Spring Actuator (WIP)
1. Introduction
Spring Boot provides utilities for monitoring the state of a Spring Boot application, for example knowing memory status, metrics, monitoring, querying runtime values, service status, etc.
These utilities can have different implementations and we can access them through web endpoints, mxbeans, java agents, etc…
As a general rule, most monitoring tools access this information through the web interface.
2. Configuration
As is natural in the Spring-Boot philosophy, it is enough to add the starter that will take care of calculating and offering those values to the classpath of our application:
        <dependency>
            <groupId>org.springframework.boot</groupId>
            <artifactId>spring-boot-starter-actuator</artifactId>
        </dependency>
And now it will only be enough to indicate which are the values that we are interested in serving and that will be consumed by our monitoring tools:
An example would be this:
management:
  endpoint:
    metrics:
      enabled: true
    prometheus:
      enabled: true
    env:
      show-values: ALWAYS
  metrics:
    export:
      prometheus:
        enabled: true
  endpoints:
    web:
      exposure:
        include: [ info, env, health, metrics, prometheus ]
management.endpoints.web.exposure: indicates which endpoints will be able to be consulted through the http interface.
management.endpoints.{}: configures the properties of each actuator.
3. Actuator /env
It offers us information about the values of all the properties of our application at runtime.
If we look closely we have configured the behavior of that actuator so that it always returns the value of the variables without encoding so we can consult it:
To do this, just visit the /actuator/env endpoint and we will get the list: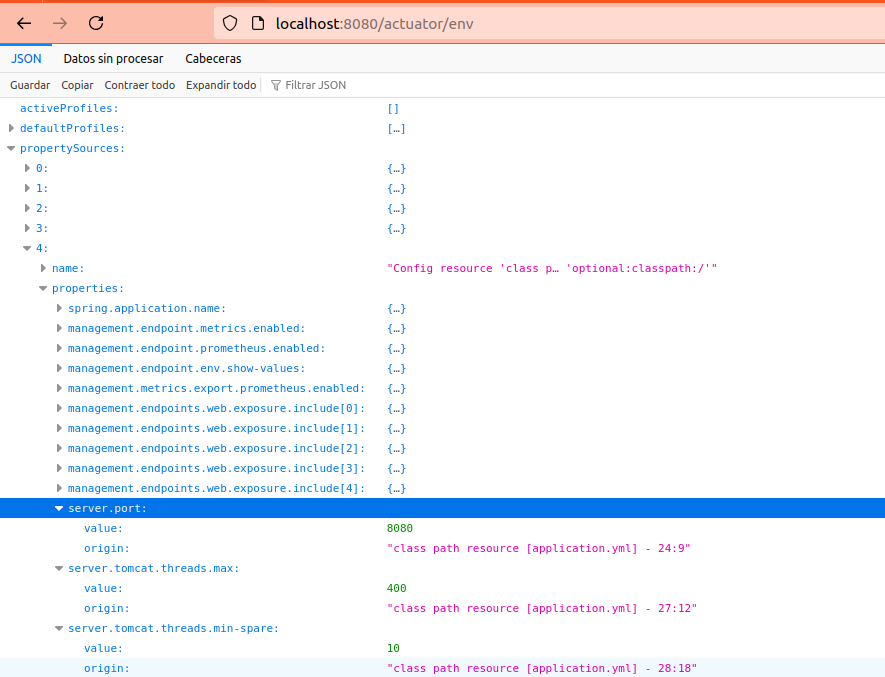
The values that you cannot see or want to consult, with which a SpringBoot version works by default, you can consult them on their official page
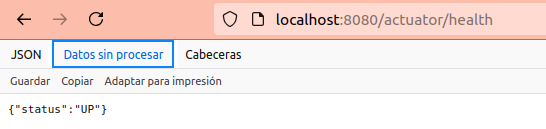
4. Actuator /health
The different services used or external (database clients, kafka-clients, etc..) can implement a way to indicate their health (if they are down, if they need restart, if they are fine and function normally), this is called HealthCheck.
Spring boot is able to recognize all the health check services of the components within the application and monitor them.
If all healthchecks respond with OK, when we visit the /actuator/health endpoint it will respond with an “UP”.
If on the contrary one indicates anomaly and its implementation responds with DOWN, it will condition the final response of the actuator indicating a “DOWN”, that is, if any of the services is not working correctly, the endpoint will indicate a “DOWN”.
4. Actuator /info (WIP)
Explain what info the /info gives and how to customize it with the plugin
5. Actuator /custom (WIP)
Indicate how to create your own actuator